Bug #4607
open
TVHeadend crash (out of memory)
0%
Description
I have a problem with some of my TVHeadend VMs. They regularly crash with an out-of-memory message.
I have 1 ESXi host with the following config:
1. Linux Debian 9 + DVBSky S960 + TVheadend 4.3-330~g1c6c91508
2. Linux Debian 9 + DVBSky S960 + TVheadend 4.3-295~ga9dffb7e9
3. Linux Debian 9 + Terratec H7 + TVHeadend 4.3-322~g096079129
4. Linux Debian 9 + Terratec H7 + TVheadend 4.3-358~g99d191a46
5. Linux Debian 8 + TBS Qbox 5980 + TVHeadend 4.1-2449~gda58349
+ a few other VMs that have nothing to do with TVHeadend
Furthermore, I also have a RPi + DVBSky S960 + Tvheadend 4.3-117~gddf420b
This config has been in use for a few years, and never caused any real issues.
My problems started a few days after I upgraded from Debian 8 to Debian 9.
I was unable to get the drivers of the TBS working, so that VM (#5) stayed on Debian 8. It has not been affected by this problem.
After the upgrade to Debian 9, I recompiled the drivers for the DVB hardware and TVHeadend itself. All VMs (except #5) were at 4.3-295 then.
3 of the 4 other VMs have crashed multiple times since the upgrade to Debian 9. I don't think VM #2 ever crashed, even though it has the same hardware and config as #1.
After the crash I upgraded and recompiled TVheadend, hence all the different versions I have now.
#1 seems to be most affected. It crashed at least 3 times yesterday.
This is a part from the messages log from yesterday
Sep 17 09:38:03 caladan kernel: [28719.338548] ntpd invoked oom-killer: gfp_mask=0x24201ca(GFP_HIGHUSER_MOVABLE|__GFP_COLD), nodemask=0, order=0, oom_score_adj=0
Sep 17 09:38:03 caladan kernel: [28719.338549] ntpd cpuset=/ mems_allowed=0
Sep 17 09:38:03 caladan kernel: [28719.338559] CPU: 0 PID: 514 Comm: ntpd Not tainted 4.9.0-3-amd64 #1 Debian 4.9.30-2+deb9u3
Sep 17 09:38:03 caladan kernel: [28719.338560] Hardware name: VMware, Inc. VMware Virtual Platform/440BX Desktop Reference Platform, BIOS 6.00 09/21/2015
Sep 17 09:38:03 caladan kernel: [28719.338561]  0000000000000000 ffffffff8b928574 ffff9e66c0bdfc38 ffff8bffda5d3080
Sep 17 09:38:03 caladan kernel: [28719.338563]  ffffffff8b7fe050 0000000000000000 0000000000000000 0000000c024213ca
Sep 17 09:38:03 caladan kernel: [28719.338564]  ffffffff8b7844e7 00000042df117040 0000000000000000 7e26a2f7f02060be
Sep 17 09:38:03 caladan kernel: [28719.338565] Call Trace:
Sep 17 09:38:03 caladan kernel: [28719.338593]  [<ffffffff8b928574>] ? dump_stack+0x5c/0x78
Sep 17 09:38:03 caladan kernel: [28719.338600]  [<ffffffff8b7fe050>] ? dump_header+0x78/0x1fd
Sep 17 09:38:03 caladan kernel: [28719.338606]  [<ffffffff8b7844e7>] ? get_page_from_freelist+0x3f7/0xb40
Sep 17 09:38:03 caladan kernel: [28719.338610]  [<ffffffff8b78047a>] ? oom_kill_process+0x21a/0x3e0
Sep 17 09:38:03 caladan kernel: [28719.338611]  [<ffffffff8b7800fd>] ? oom_badness+0xed/0x170
Sep 17 09:38:03 caladan kernel: [28719.338612]  [<ffffffff8b780911>] ? out_of_memory+0x111/0x470
Sep 17 09:38:03 caladan kernel: [28719.338613]  [<ffffffff8b785b4f>] ? __alloc_pages_slowpath+0xb7f/0xbc0
Sep 17 09:38:03 caladan kernel: [28719.338614]  [<ffffffff8b785d8e>] ? __alloc_pages_nodemask+0x1fe/0x260
Sep 17 09:38:03 caladan kernel: [28719.338619]  [<ffffffff8b7d5ec1>] ? alloc_pages_current+0x91/0x140
Sep 17 09:38:03 caladan kernel: [28719.338621]  [<ffffffff8b77e940>] ? filemap_fault+0x300/0x5a0
Sep 17 09:38:03 caladan kernel: [28719.338635]  [<ffffffffc05f9791>] ? ext4_filemap_fault+0x31/0x50 [ext4]
Sep 17 09:38:03 caladan kernel: [28719.338638]  [<ffffffff8b7aeef1>] ? __do_fault+0x81/0x170
Sep 17 09:38:03 caladan kernel: [28719.338640]  [<ffffffff8b7b3671>] ? handle_mm_fault+0xdd1/0x1350
Sep 17 09:38:03 caladan kernel: [28719.338647]  [<ffffffff8b65fd84>] ? __do_page_fault+0x2a4/0x510
Sep 17 09:38:03 caladan kernel: [28719.338656]  [<ffffffff8bc07658>] ? page_fault+0x28/0x30
Sep 17 09:38:03 caladan kernel: [28719.338657] Mem-Info:
Sep 17 09:38:03 caladan kernel: [28719.338661] active_anon:55502 inactive_anon:55559 isolated_anon:0
Sep 17 09:38:03 caladan kernel: [28719.338661]  active_file:203 inactive_file:227 isolated_file:0
Sep 17 09:38:03 caladan kernel: [28719.338661]  unevictable:0 dirty:0 writeback:0 unstable:2
Sep 17 09:38:03 caladan kernel: [28719.338661]  slab_reclaimable:2182 slab_unreclaimable:3214
Sep 17 09:38:03 caladan kernel: [28719.338661]  mapped:265 shmem:75 pagetables:1076 bounce:0
Sep 17 09:38:03 caladan kernel: [28719.338661]  free:1116 free_pcp:70 free_cma:0
Sep 17 09:38:03 caladan kernel: [28719.338664] Node 0 active_anon:222008kB inactive_anon:222236kB active_file:812kB inactive_file:908kB unevictable:0kB isolated(anon):0kB isolated(file):0kB mapped:1060kB dirty:0kB writeback:0kB shmem:300kB shmem_thp: 0kB shmem_pmdmapped: 0kB anon_thp: 0kB writeback_tmp:0kB unstable:8kB pages_scanned:13301 all_unreclaimable? yes
Sep 17 09:38:03 caladan kernel: [28719.338665] Node 0 DMA free:1876kB min:88kB low:108kB high:128kB active_anon:6328kB inactive_anon:7100kB active_file:0kB inactive_file:0kB unevictable:0kB writepending:0kB present:15992kB managed:15908kB mlocked:0kB slab_reclaimable:24kB slab_unreclaimable:12kB kernel_stack:16kB pagetables:84kB bounce:0kB free_pcp:0kB local_pcp:0kB free_cma:0kB
Sep 17 09:38:03 caladan kernel: [28719.338667] lowmem_reserve[]: 0 455 455 455 455
Sep 17 09:38:03 caladan kernel: [28719.338669] Node 0 DMA32 free:2588kB min:2684kB low:3352kB high:4020kB active_anon:215680kB inactive_anon:215136kB active_file:812kB inactive_file:908kB unevictable:0kB writepending:0kB present:507840kB managed:488500kB mlocked:0kB slab_reclaimable:8704kB slab_unreclaimable:12844kB kernel_stack:1632kB pagetables:4220kB bounce:0kB free_pcp:280kB local_pcp:280kB free_cma:0kB
Sep 17 09:38:03 caladan kernel: [28719.338671] lowmem_reserve[]: 0 0 0 0 0
Sep 17 09:38:03 caladan kernel: [28719.338672] Node 0 DMA: 27*4kB (UME) 17*8kB (UME) 16*16kB (U) 3*32kB (UME) 12*64kB (UME) 4*128kB (UM) 0*256kB 0*512kB 0*1024kB 0*2048kB 0*4096kB = 1876kB
Sep 17 09:38:03 caladan kernel: [28719.338687] Node 0 DMA32: 647*4kB (U) 0*8kB 0*16kB 0*32kB 0*64kB 0*128kB 0*256kB 0*512kB 0*1024kB 0*2048kB 0*4096kB = 2588kB
Sep 17 09:38:03 caladan kernel: [28719.338690] Node 0 hugepages_total=0 hugepages_free=0 hugepages_surp=0 hugepages_size=2048kB
Sep 17 09:38:03 caladan kernel: [28719.338691] 1113 total pagecache pages
Sep 17 09:38:03 caladan kernel: [28719.338691] 608 pages in swap cache
Sep 17 09:38:03 caladan kernel: [28719.338692] Swap cache stats: add 198871, delete 198263, find 7938/13916
Sep 17 09:38:03 caladan kernel: [28719.338692] Free swap  = 0kB
Sep 17 09:38:03 caladan kernel: [28719.338693] Total swap = 731132kB
Sep 17 09:38:03 caladan kernel: [28719.338693] 130958 pages RAM
Sep 17 09:38:03 caladan kernel: [28719.338693] 0 pages HighMem/MovableOnly
Sep 17 09:38:03 caladan kernel: [28719.338693] 4856 pages reserved
Sep 17 09:38:03 caladan kernel: [28719.338694] 0 pages hwpoisoned
Sep 17 09:38:03 caladan kernel: [28719.338694] [ pid ]   uid  tgid total_vm      rss nr_ptes nr_pmds swapents oom_score_adj name
Sep 17 09:38:03 caladan kernel: [28719.338697] [  196]     0   196    13890      114      24       3       92             0 systemd-journal
Sep 17 09:38:03 caladan kernel: [28719.338698] [  199]     0   199    33443       84      56       3      261             0 vmtoolsd
Sep 17 09:38:03 caladan kernel: [28719.338699] [  240]     0   240    11669       13      22       3      469         -1000 systemd-udevd
Sep 17 09:38:03 caladan kernel: [28719.338699] [  255]     0   255    12468        0      28       3      115             0 rpcbind
Sep 17 09:38:03 caladan kernel: [28719.338700] [  311]     0   311    38372        1      65       3      865             0 VGAuthService
Sep 17 09:38:03 caladan kernel: [28719.338701] [  312]     0   312     1054        0       8       3       36             0 acpid
Sep 17 09:38:03 caladan kernel: [28719.338702] [  313]     0   313    62529       47      30       3      160             0 rsyslogd
Sep 17 09:38:03 caladan kernel: [28719.338703] [  314]   106   314    11283       23      26       3       93          -900 dbus-daemon
Sep 17 09:38:03 caladan kernel: [28719.338704] [  319]     0   319     7409       17      18       3       45             0 cron
Sep 17 09:38:03 caladan kernel: [28719.338705] [  321]     0   321     9495       30      22       3      100             0 systemd-logind
Sep 17 09:38:03 caladan kernel: [28719.338706] [  456]     0   456    17486        0      37       3      194         -1000 sshd
Sep 17 09:38:03 caladan kernel: [28719.338707] [  475]   108   475     8858        0      22       3      202             0 rpc.statd
Sep 17 09:38:03 caladan kernel: [28719.338708] [  502]     0   502     3634        0      12       3       40             0 agetty
Sep 17 09:38:03 caladan kernel: [28719.338709] [  512]   107   512   444318   109652     654       5   178829             0 tvheadend
Sep 17 09:38:03 caladan kernel: [28719.338709] [  514]   105   514    24463       33      21       3       99             0 ntpd
Sep 17 09:38:03 caladan kernel: [28719.373963] oom_reaper: reaped process 512 (tvheadend), now anon-rss:0kB, file-rss:0kB, shmem-rss:0kB
A few more things I have tried beside upgrading/recompiling TVH:
- switch the DVB-hardware between #1 and #2
- switch the DVB-hardware between #1 and the RPi
- move everything (VMs + DVB-hardware) to a new ESXi-host
- memory test on the old ESXi-host => no problems found
- harddrive test on the old ESXi-host => no problems found
VM#1 and VM#2 have been assigned 512MB of RAM, VM#3 and VM#4 have been assigned 1GB of RAM.
While 512MB may be a bit marginal (is it?), the problem also occurs on VM#3 and #4 (but not on #2 - as of today)
The ESXi-host is not oversubscribed, it has 64GB of RAM
I am not sure if this is a problem with TVHeadend itself.
As far as I'm concerned it can also be something to do with the Kernel. Debian 9 uses 4.9, Debian 8 is still at 3.16
Over at the LibreElec forum there is a topic about issues with DVB-adapters and Kernel 4.9
This one: https://forum.libreelec.tv/thread/4235-dvb-issue-since-le-switched-to-kernel-4-9-x/
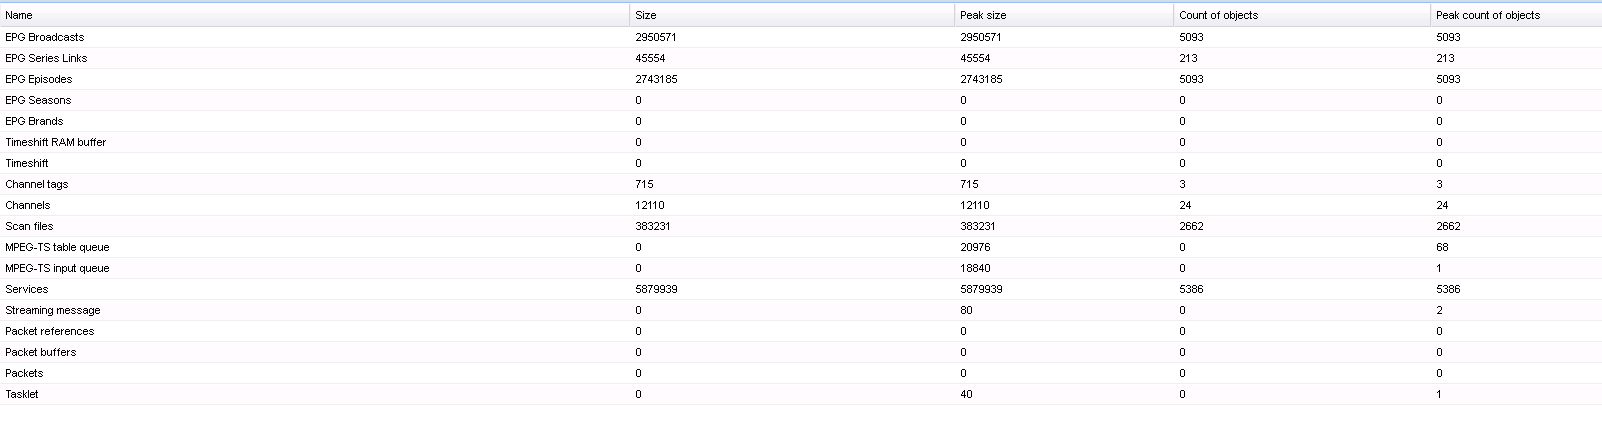
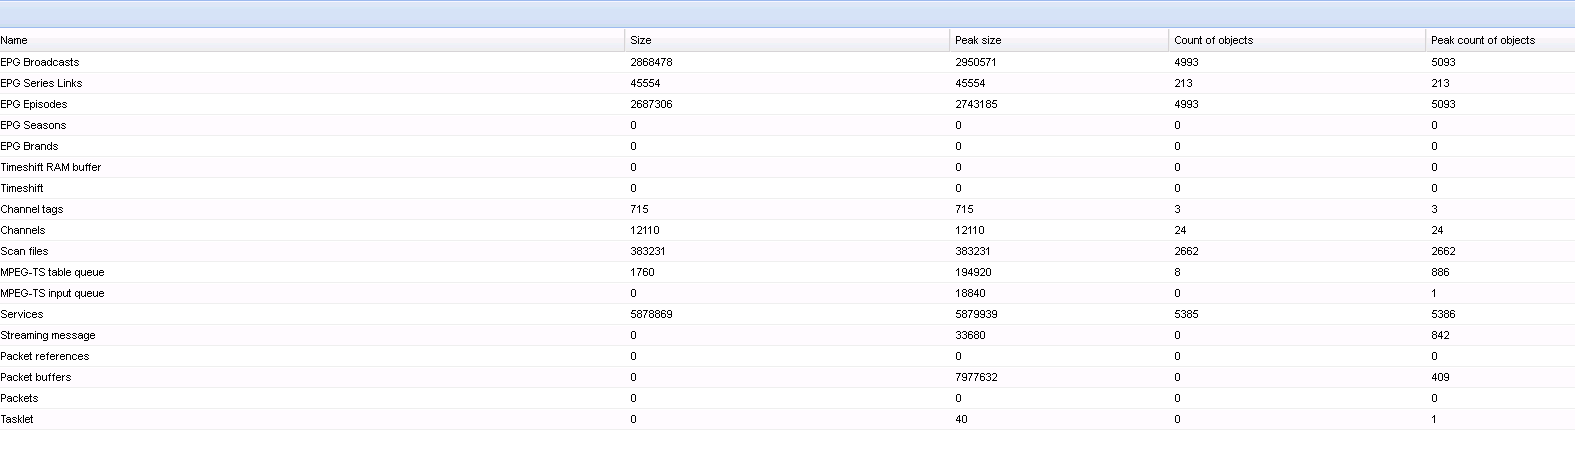
These are the current values of the top command:
VM #1
top - 20:46:25 up  3:28,  1 user,  load average: 0.11, 0.11, 0.09
Tasks:  76 total,   2 running,  74 sleeping,   0 stopped,   0 zombie
%Cpu(s):  0.7 us,  2.1 sy,  0.0 ni, 93.1 id,  3.8 wa,  0.0 hi,  0.3 si,  0.0 st
KiB Mem :   504408 total,     6748 free,   466604 used,    31056 buff/cache
KiB Swap:   731132 total,   712908 free,    18224 used.    23576 avail Mem

  PID USER      PR  NI    VIRT    RES    SHR S %CPU %MEM     TIME+ COMMAND
  512 hts       20   0 1048324 412448    768 S  4.7 81.8   5:23.21 tvheadend
  931 root      20   0       0      0      0 S  0.3  0.0   0:01.37 kworker/0:1
  934 root      20   0   44916   3396   2768 R  0.3  0.7   0:00.07 top
    1 root      20   0   57020   1688    816 S  0.0  0.3   0:00.44 systemd
    2 root      20   0       0      0      0 S  0.0  0.0   0:00.00 kthreadd
VM #2
top - 20:47:18 up 73 days,  3:09,  1 user,  load average: 0.00, 0.00, 0.00
Threads: 115 total,   1 running, 114 sleeping,   0 stopped,   0 zombie
%Cpu(s):  0.0 us,  0.0 sy,  0.0 ni,100.0 id,  0.0 wa,  0.0 hi,  0.0 si,  0.0 st
KiB Mem :   504408 total,     6692 free,   231556 used,   266160 buff/cache
KiB Swap:   731132 total,   687656 free,    43476 used.   254768 avail Mem

  PID USER      PR  NI    VIRT    RES    SHR S %CPU %MEM     TIME+ COMMAND
  540 hts       20   0  854320 169684      0 S  0.3 33.6 185:53.61 tvheadend
    1 root      20   0   57148   4544   2932 S  0.0  0.9   0:21.13 systemd
    2 root      20   0       0      0      0 S  0.0  0.0   0:01.06 kthreadd
    3 root      20   0       0      0      0 S  0.0  0.0   0:31.59 ksoftirqd/0
    5 root       0 -20       0      0      0 S  0.0  0.0   0:00.00 kworker/0:0H
VM#3
top - 20:52:35 up 1 day, 19:09,  1 user,  load average: 0.02, 0.07, 0.08
Tasks:  98 total,   1 running,  97 sleeping,   0 stopped,   0 zombie
%Cpu(s):  0.0 us,  0.3 sy,  0.0 ni, 99.7 id,  0.0 wa,  0.0 hi,  0.0 si,  0.0 st
KiB Mem :  1020488 total,   313844 free,   355928 used,   350716 buff/cache
KiB Swap:   731132 total,   731132 free,        0 used.   512592 avail Mem

  PID USER      PR  NI    VIRT    RES    SHR S %CPU %MEM     TIME+ COMMAND
  137 root      20   0       0      0      0 S  0.3  0.0   0:36.75 kworker/0:3
  377 root      20   0       0      0      0 S  0.3  0.0   7:17.52 kdvb-ca-0:0
  541 hts       20   0  915392 304216   8840 S  0.3 29.8  12:37.94 tvheadend
 4613 root      20   0   44916   3804   3148 R  0.3  0.4   0:00.01 top
    1 root      20   0   57028   6776   5224 S  0.0  0.7   0:00.81 systemd
    2 root      20   0       0      0      0 S  0.0  0.0   0:00.02 kthreadd
VM #4
top - 20:54:23 up 25 days,  1:31,  1 user,  load average: 0.11, 0.09, 0.09
Tasks:  90 total,   1 running,  89 sleeping,   0 stopped,   0 zombie
%Cpu(s):  0.0 us,  0.3 sy,  0.0 ni, 99.3 id,  0.0 wa,  0.0 hi,  0.3 si,  0.0 st
KiB Mem :  1020488 total,    74744 free,    86772 used,   858972 buff/cache
KiB Swap:   731132 total,   731132 free,        0 used.   777576 avail Mem

  PID USER      PR  NI    VIRT    RES    SHR S %CPU %MEM     TIME+ COMMAND
  574 hts       20   0  718312  30400   8672 S  0.7  3.0 317:54.87 tvheadend
  414 root      20   0       0      0      0 S  0.3  0.0 102:14.88 kdvb-ca-0:0
18768 root      20   0       0      0      0 S  0.3  0.0   0:00.13 kworker/u2:2
    1 root      20   0   57020   6836   5284 S  0.0  0.7   0:06.67 systemd
    2 root      20   0       0      0      0 S  0.0  0.0   0:00.30 kthreadd
VM #5
top - 20:49:09 up 41 days,  8:10,  1 user,  load average: 0.11, 0.11, 0.13
Tasks:  78 total,   1 running,  77 sleeping,   0 stopped,   0 zombie
%Cpu(s):  0.4 us,  0.4 sy,  0.0 ni, 94.4 id,  4.9 wa,  0.0 hi,  0.0 si,  0.0 st
KiB Mem:    506280 total,   499980 used,     6300 free,    41928 buffers
KiB Swap:   731132 total,    14044 used,   717088 free.   352520 cached Mem

  PID USER      PR  NI    VIRT    RES    SHR S %CPU %MEM     TIME+ COMMAND
  478 tvheade+  20   0  873196  32900   1600 S  3.3  6.5 352:57.67 tvheadend
    1 root      20   0   28296   2748   1876 S  0.0  0.5   0:25.99 systemd
    2 root      20   0       0      0      0 S  0.0  0.0   0:00.54 kthreadd
    3 root      20   0       0      0      0 S  0.0  0.0  78:07.46 ksoftirqd/0
    5 root       0 -20       0      0      0 S  0.0  0.0   0:00.00 kworker/0:0H
RPi
top - 20:50:47 up 1 day,  1:36,  1 user,  load average: 0.00, 0.00, 0.00
Tasks: 114 total,   1 running, 113 sleeping,   0 stopped,   0 zombie
%Cpu(s):  0.2 us,  0.0 sy,  0.0 ni, 99.8 id,  0.0 wa,  0.0 hi,  0.0 si,  0.0 st
KiB Mem:    933352 total,   832384 used,   100968 free,    93328 buffers
KiB Swap:   102396 total,        0 used,   102396 free.   673768 cached Mem

  PID USER      PR  NI    VIRT    RES    SHR S  %CPU %MEM     TIME+ COMMAND
10218 pi        20   0    5240   2592   2148 R   1.3  0.3   0:00.16 top
    6 root      20   0       0      0      0 S   0.3  0.0   0:00.68 kworker/u8:0
  757 tvheade+  20   0  317648  25748   6760 S   0.3  2.8  59:24.99 tvheadend
10205 root      20   0       0      0      0 S   0.3  0.0   0:00.04 kworker/0:2
    1 root      20   0    5400   3916   2788 S   0.0  0.4   0:09.07 systemd
    2 root      20   0       0      0      0 S   0.0  0.0   0:00.12 kthreadd
The uptime is an indication of the last crash on each VM.
The RPi's last reboot had nothing to do with TVheadend or a crash and can be ignored.
Files
 Updated by
  Updated by
  Updated by
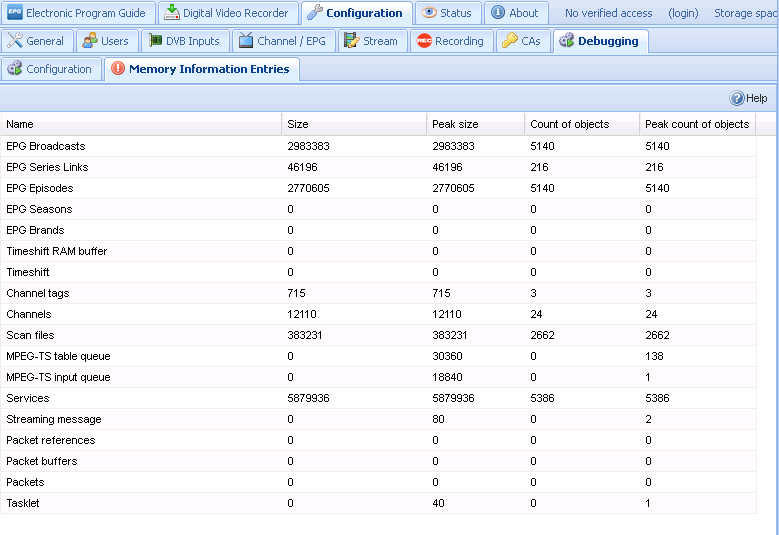